
How to Draw Fibonacci Retracements in a Downtrend (Bear Market Guide)
Learn how to draw Fibonacci retracements in a bearish trend from Swing High to Swing Low to catch low-risk short entry opportunities.
🔧 Interactive Utility Tool
Try the free, 100% secure client-side tool associated with this guide. No registration required.
How to Draw Fibonacci Retracements in a Downtrend
Understanding technical chart lines is key to planning successful trades. Here is a direct breakdown of how this calculation works.
A Fibonacci technical indicator is a charting tool that projects support and resistance zones based on mathematical ratios (e.g., 38.2%, 61.8%). By connecting price extremes, traders identify trend pivot points and plan entry coordinates.
In standard trading resources, Fibonacci retracements are typically explained using bullish uptrend scenarios. However, drawing Fibonacci levels in a bear market is equally critical. During a downtrend, retracements allow traders to identify precise, objective, and mathematical entry points to short-sell assets when they experience temporary relief rallies.
In this guide, we'll demonstrate how to draw Fibonacci retracements in a bearish market, explore the key entries, and explain how to manage risk.
Product-Led CTA: Calculating these ratios manually on price charts is slow and prone to math errors. Use our free, local Fibonacci Calculator to get instant, precise retracement coordinates for your setup.
📏 Drawing the Downtrend Fibonacci Grid
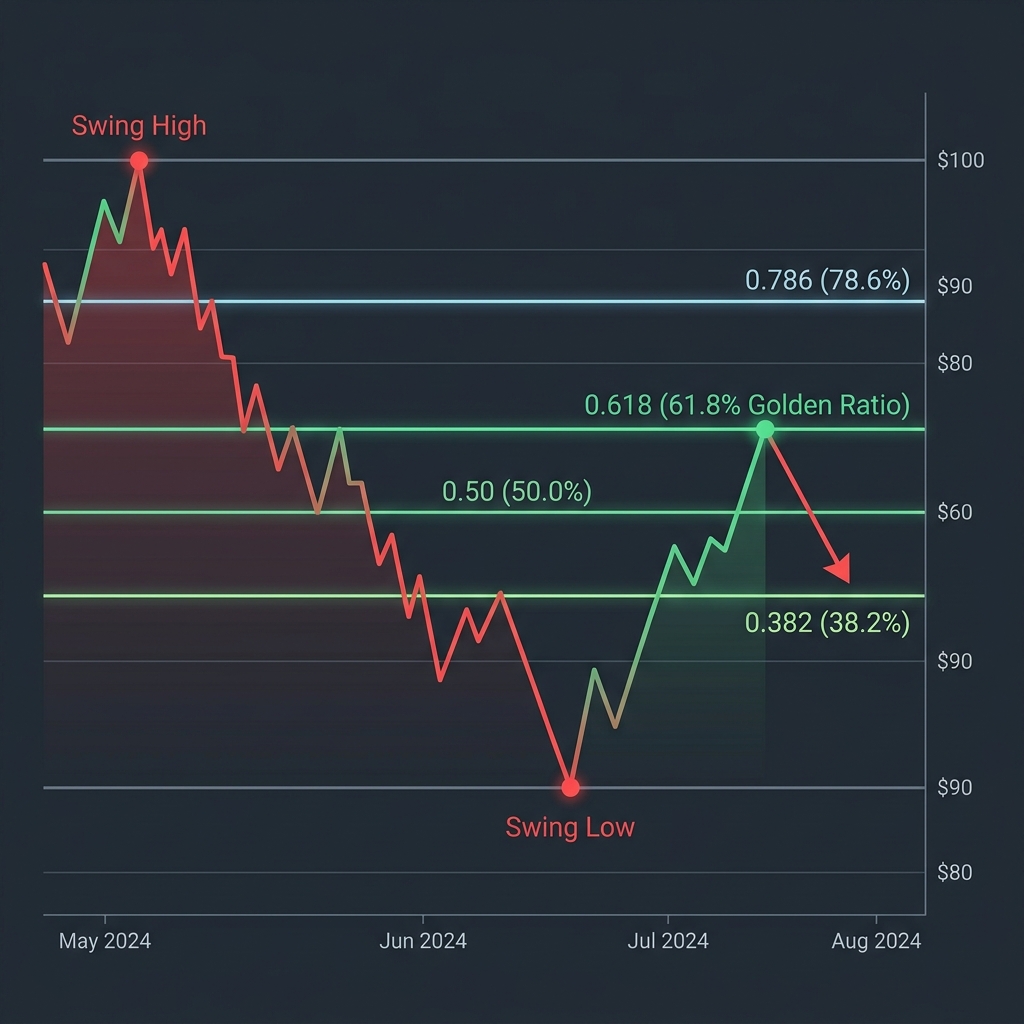
To plot retracements during a bearish cycle, you must identify a clear downward impulse wave. The grid requires two anchor points: the Swing High (origin of the dump) and the Swing Low (bottom of the impulse before consolidation).
⚡ Quick Action: Use the Online Tool
This guide pairs with our free, 100% secure client-side utility tool. Process your files or text instantly in-browser.
Step-by-Step Drawing Rules:
- Anchor 1: Select your charting library's Fibonacci Retracement tool and click on the absolute wick peak of the Swing High.
- Anchor 2: Drag the cursor down and to the right, clicking on the absolute wick bottom of the Swing Low.
This projects Fibonacci percentage grids above the Swing Low, showing the potential resistance targets of the relief rally.
📊 Bear Market Retracement Infographic
Below is a visual layout demonstrating a standard bearish trend impulse, followed by a relief rally that reacts to the Golden Ratio boundary before resuming its downward trend:
🎯 Key Retracement Entries for Short Trades
During a bear market rally, specific Fibonacci levels serve as critical resistance targets for short entries:
| Retracement Level | Ratio | Market Psychology |
|---|---|---|
| 0.382 (38.2%) | Weak relief rally. Indicates extreme seller dominance. | Price often fails to break above this in strong downtrends; short entries here have tight stops. |
| 0.500 (50.0%) | The mid-point of the drop. Psychological balance point. | Highly watched by algorithms for short-term pivots. |
| 0.618 (61.8%) | The Golden Ratio. The prime short entry zone. | Often experiences major seller rejection. Excellent confluence when aligned with historical horizontal resistance. |
🛠️ Risk Management and Invalidation Rules
To protect your capital when shorting: 1. Stop-Loss Placement: Set your stop-loss order slightly above the 0.786 retracement level. If the price rises past 0.786, the bearish trend structure is invalid. 2. Size Your Position: Use a Position Size Calculator to ensure that your risk distance matches your budget. 3. Target Extensions: Once your short entry is filled at the 0.618 level, use Fibonacci Extensions to plot profit targets below the previous Swing Low.
For a comparison of bullish setups, check out our Uptrend Fibonacci Retracement Guide or play around with the settings on our Fibonacci Calculator Tool.
Join the Urbandigistore Hub
Subscribe to receive premium developer cheat sheets, advanced conversion techniques, and campaign optimization checklists. Zero spam, unsubscribe anytime.
🚀 Launch Interactive Tool
Ready to test this directly? Open the secure web tool in a new sandbox tab.