
How to Draw Fibonacci Arcs (Mapping Curved Support Zones)
Learn how to draw Fibonacci arcs using Swing Low and Swing High coordinates to map curved, time-adjusted support and resistance zones.
🔧 Interactive Utility Tool
Try the free, 100% secure client-side tool associated with this guide. No registration required.
How to Draw Fibonacci Arcs to Map Curved Support
Understanding technical chart lines is key to planning successful trades. Here is a direct breakdown of how this calculation works.
A Fibonacci technical indicator is a charting tool that projects support and resistance zones based on mathematical ratios (e.g., 38.2%, 61.8%). By connecting price extremes, traders identify trend pivot points and plan entry coordinates.
Most technical indicators project horizontal or diagonal support lines. However, market trends are dynamic, moving across both price and time. To identify curved, circular zones where buying or selling pressure is likely to reverse, technical analysts use Fibonacci Arcs.
In this guide, we'll explain how to draw Fibonacci arcs, identify speed boundaries, and manage target zones.
Product-Led CTA: Calculating these ratios manually on price charts is slow and prone to math errors. Use our free, local Fibonacci Calculator to get instant, precise retracement coordinates for your setup.
📐 The Geometry of Fibonacci Arcs
Fibonacci arcs are curved lines drawn outwards from a primary trend line (drawn between a Swing Low and a Swing High):
⚡ Quick Action: Use the Online Tool
This guide pairs with our free, 100% secure client-side utility tool. Process your files or text instantly in-browser.
- The Baseline: The radius of the circles is calculated from the distance of the trend line.
- The Arcs: The tool draws three concentric arcs at distance intervals matching 38.2%, 50.0%, and 61.8% of the radius.
- Because the boundaries are circular, they account for time. As price advances along the time axis, the support or resistance level curves upward or downward dynamically.
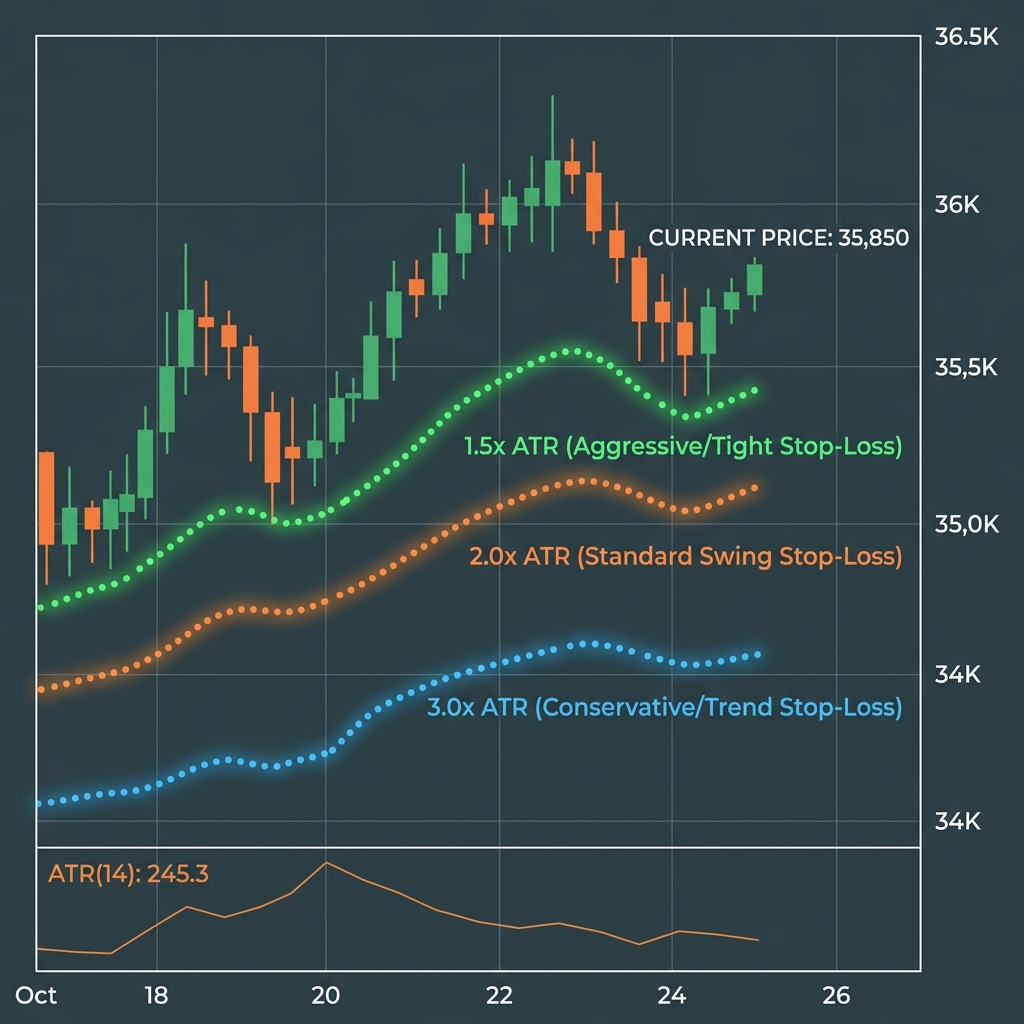
📊 Technical Volatility and Trend Support Reference
Below is a volatility reference chart demonstrating how prices react when hitting dynamic boundary envelopes:
📏 How to Draw Fibonacci Arcs
To plot arcs on your charts:
- Anchor 1 (The Wave Start): Click on the starting coordinate of the major impulse (the Swing Low in a bull market, or Swing High in a bear market).
- Anchor 2 (The Wave Peak): Drag and click on the trend peak (the Swing High in a bull market, or Swing Low in a bear market).
The tool will project three curved arcs centered on Anchor 2: * 38.2% Arc: The inner boundary. Often acts as initial support during quick pullbacks. * 50.0% Arc: The median boundary. * 61.8% Arc: The outer boundary. A clean break below this arc indicates trend exhaustion and a likely reversal.
🎯 Sizing Your Trade Exits
When trading near curved zones: * Time Deceleration: Arcs help you anticipate the timing of consolidation. If price approaches the outer 61.8% arc, expect the trend to pause or reverse. * To calculate trading coordinates directly, use our browser-based Fibonacci Calculator. * For horizontal projections, see How to Draw Fibonacci Extensions. To view arc speed zones, read our Fibonacci Arcs Curved Support Guide.
Join the Urbandigistore Hub
Subscribe to receive premium developer cheat sheets, advanced conversion techniques, and campaign optimization checklists. Zero spam, unsubscribe anytime.
🚀 Launch Interactive Tool
Ready to test this directly? Open the secure web tool in a new sandbox tab.