
How to Draw Fibonacci Fans in a Downtrend: Diagonal Resistance Speed Lines
Learn how to draw Fibonacci fans in a bearish trend using two anchors to project diagonal resistance speed lines for planning short entries.
🔧 Interactive Utility Tool
Try the free, 100% secure client-side tool associated with this guide. No registration required.
How to Draw Bearish Fibonacci Fans
Understanding technical chart lines is key to planning successful trades. Here is a direct breakdown of how this calculation works.
A Fibonacci technical indicator is a charting tool that projects support and resistance zones based on mathematical ratios (e.g., 38.2%, 61.8%). By connecting price extremes, traders identify trend pivot points and plan entry coordinates.
In a bearish market, prices do not fall continuously without relief rallies. Bear markets are marked by temporary upward corrections that eventually stall and reverse. To locate these dynamic, diagonal resistance levels during a downtrend, traders use bearish Fibonacci Fans.
Product-Led CTA: Calculating these ratios manually on price charts is slow and prone to math errors. Use our free, local Fibonacci Calculator to get instant, precise retracement coordinates for your setup.
📐 Bearish Fibonacci Fans: The Concept
A bearish Fibonacci fan uses the price-time coordinates of a falling impulse leg to project three diagonal resistance speed lines: * The Trendline: The baseline connecting the Swing High to the Swing Low. * The Fan Lines: Lines extending from the Swing High crossing an invisible vertical line at the Fibonacci ratios (38.2%, 50.0%, and 61.8%). * These lines project diagonal resistance zones where counter-trend rallies are expected to face selling pressure.
⚡ Quick Action: Use the Online Tool
This guide pairs with our free, 100% secure client-side utility tool. Process your files or text instantly in-browser.
📊 Bear Market Trend Projections Reference
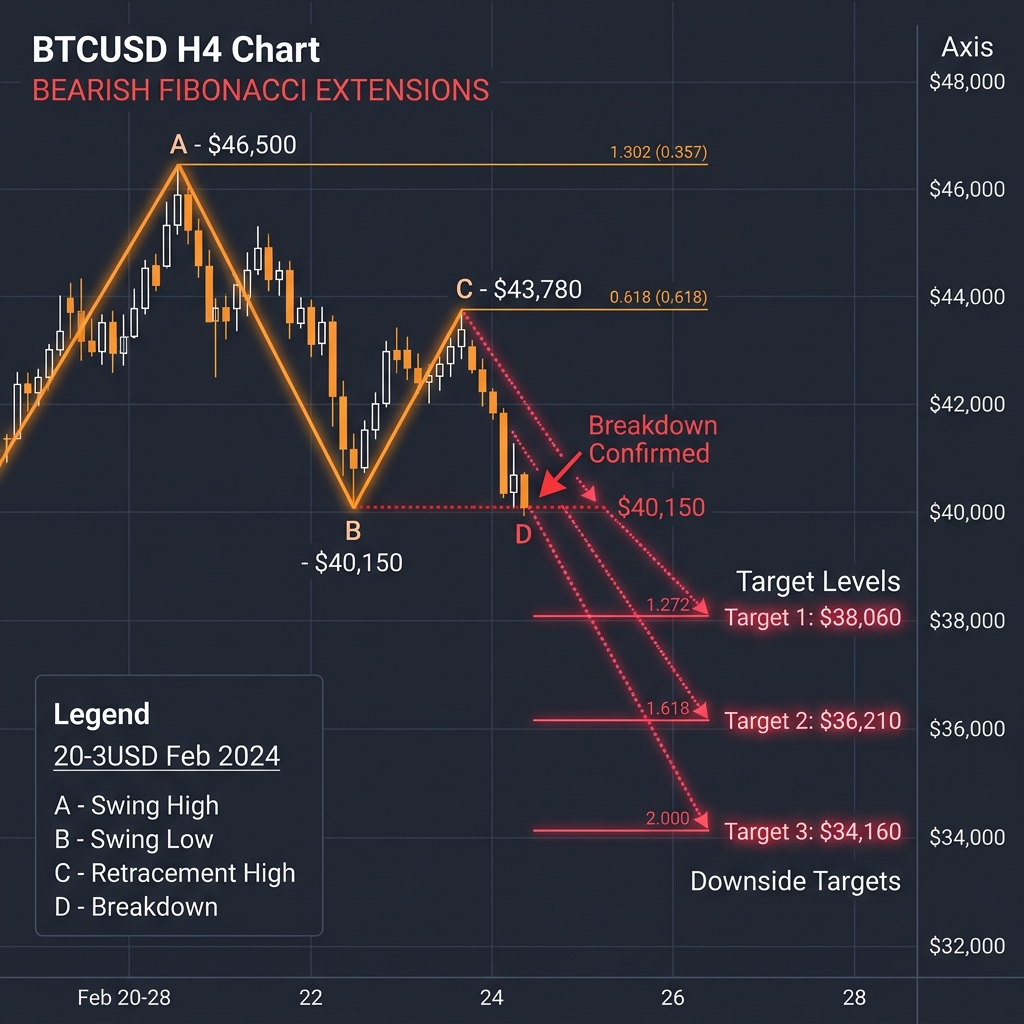
Below is a technical layout illustrating price waves encountering diagonal and horizontal resistance markers during a market downtrend:
📏 Step-by-Step Drawing Guide
In your charting software, select the Fibonacci Fan tool:
- Click Anchor 1 (The Swing High): Click on the peak where the downward trend leg began.
- Click Anchor 2 (The Swing Low): Drag down-and-right to click on the bottom of the sell-off before the counter-trend rally started.
The tool will draw three diagonal rays extending from the Swing High: * 38.2% Fan Line: The shallowest diagonal resistance. Pullbacks that fail to cross this level indicate extreme bearish momentum. * 50.0% Fan Line: The middle resistance line. Acts as the standard rally pivot. * 61.8% Fan Line: The ultimate trend boundary. Price must remain below this diagonal line to sustain the bearish structure; a breakout above it signals that the downtrend has ended.
🎯 Short Entry Tactics
When trading bearish fans: * Wait for Reversal Confirmations: Watch for bearish candlesticks (like shooting stars or bearish engulfing candles) as price approaches a fan line. * Check out How to Draw Fibonacci Fans in a Downtrend and How to Draw Fibonacci Retracements in a Bear Market for more trading guides.
Join the Urbandigistore Hub
Subscribe to receive premium developer cheat sheets, advanced conversion techniques, and campaign optimization checklists. Zero spam, unsubscribe anytime.
🚀 Launch Interactive Tool
Ready to test this directly? Open the secure web tool in a new sandbox tab.