
How to Draw Fibonacci Extension Levels in a Downtrend (Bearish Guide)
Learn how to draw Fibonacci extensions during a bearish breakout to project downward extension profit targets for short positions.
🔧 Interactive Utility Tool
Try the free, 100% secure client-side tool associated with this guide. No registration required.
How to Draw Fibonacci Extensions in a Downtrend
Understanding technical chart lines is key to planning successful trades. Here is a direct breakdown of how this calculation works.
A Fibonacci technical indicator is a charting tool that projects support and resistance zones based on mathematical ratios (e.g., 38.2%, 61.8%). By connecting price extremes, traders identify trend pivot points and plan entry coordinates.
Just as Fibonacci extensions help buy-and-hold investors identify upside profit targets during a breakout, they also assist short-sellers in projecting downside targets during a bearish breakdown. When an asset drops below its previous support level into a downwave, extension levels calculate how far the selling momentum is likely to push the price before finding consolidation.
In this guide, we'll explain how to draw bearish extensions, detail key downside targets, and analyze risk rules.
Product-Led CTA: Calculating these ratios manually on price charts is slow and prone to math errors. Use our free, local Fibonacci Calculator to get instant, precise retracement coordinates for your setup.
📐 Bearish Projections: Coordinate Points
To project downside targets, you need three key price coordinate points from a bearish cycle:
⚡ Quick Action: Use the Online Tool
This guide pairs with our free, 100% secure client-side utility tool. Process your files or text instantly in-browser.
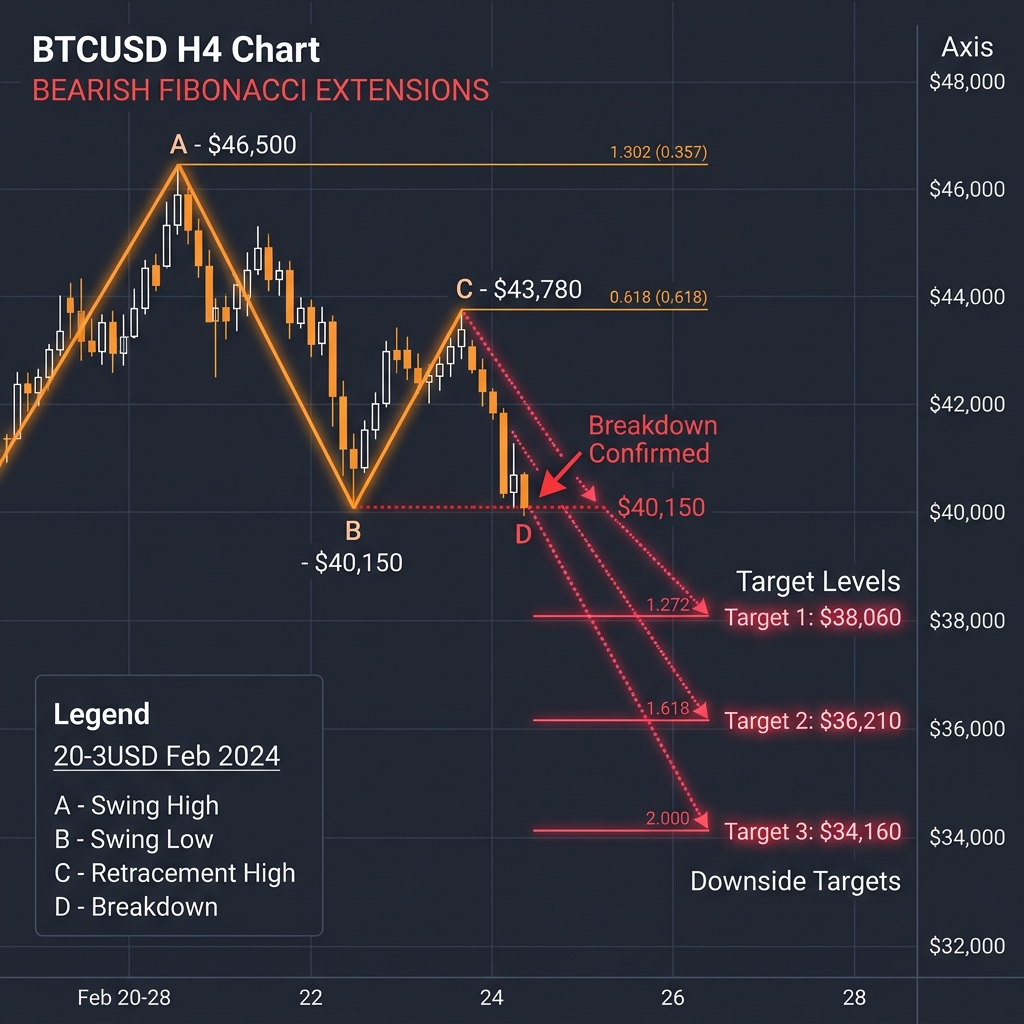
- Point A (The Swing High): The absolute peak where the bearish leg began.
- Point B (The Swing Low): The bottom of the initial downward dump before a minor bounce.
- Point C (The Retracement High): The peak of the relief rally bounce where buyers failed and selling resumed.
📊 Bearish Fibonacci Projections Infographic
Below is a technical layout illustrating price action dropping from a Swing High to a Swing Low, bouncing to a Retracement High, and breaking down toward downside extension targets:
📏 Step-by-Step Drawing Guide
In your charting software, select the Trend-Based Fibonacci Extension tool:
- Click Point A: Select the wick peak of the major Swing High.
- Click Point B: Drag down and click on the wick bottom of the Swing Low.
- Click Point C: Drag back up and click on the peak of the Retracement High.
This projects Fibonacci percentage grids below the Retracement High, mapping target supports where sellers are likely to cover short positions.
🎯 Downside Target Levels
Monitor these extensions for potential reversal or take-profit targets:
- 1.000 (100% Extension): The downward breakout wave matches the exact price size of the first downwave.
- 1.272 (127.2% Extension): A common support target for short-term swing traders.
- 1.618 (161.8% Extension): The primary algorithmic target. Downtrends often find major buy support here.
- 2.000 (200% Extension): Marks a severe dump; indicates a deep capitulation phase.
To learn more about upside targets, read How to Draw Fibonacci Extensions for Upside Profit Targets. To set stop-losses, review Bear Market Retracements or calculate levels using the Fibonacci Calculator.
Join the Urbandigistore Hub
Subscribe to receive premium developer cheat sheets, advanced conversion techniques, and campaign optimization checklists. Zero spam, unsubscribe anytime.
🚀 Launch Interactive Tool
Ready to test this directly? Open the secure web tool in a new sandbox tab.