
Stop-Loss Sizing: Position Sizing with Risk-Adjusted Sharpe Ratio
Learn how to use the Sharpe Ratio to evaluate trading strategies and optimize portfolio allocations based on risk-adjusted performance.
🔧 Interactive Utility Tool
Try the free, 100% secure client-side tool associated with this guide. No registration required.
Position Sizing with Risk-Adjusted Sharpe Ratio
Looking for a secure way to analyze and optimize your workflows? Here is a quick reference guide on the subject.
Position sizing models are risk-management calculations used to determine optimal capital allocations. By calculating metrics like ATR volatility, maximum drawdown, or the Sharpe and Sortino ratios, traders manage protection zones and limit trade losses.
When constructing a multi-asset trading portfolio, simply allocating equal capital to every trade is sub-optimal. Some strategies have high win rates but experience large drawdowns, while others have steady, low-volatility equity curves. To optimize risk-adjusted returns, quantitative managers allocate capital based on performance metrics like the Sharpe Ratio.
In this guide, we'll explain the Sharpe Ratio formula, outline volatility normalization rules, and analyze trade allocations.
Product-Led CTA: Managing risk manually is slow and leads to trading errors. Use our free, real-time Position Size Calculator to quickly model share counts and risk targets.
📐 The Sharpe Ratio Formula
The Sharpe Ratio evaluates the excess return of a strategy per unit of volatility:
⚡ Quick Action: Use the Online Tool
This guide pairs with our free, 100% secure client-side utility tool. Process your files or text instantly in-browser.
$$\text{Sharpe Ratio} = \frac{R_p - R_f}{\sigma_p}$$
Where: * $R_p$: The expected return of the trading strategy. * $R_f$: The risk-free rate of return (e.g., U.S. Treasury yields). * $\sigma_p$: The standard deviation of the strategy's returns (a measure of volatility).
A strategy with a Sharpe Ratio above 1.0 is considered good, while ratios above 2.0 indicate exceptional risk-adjusted performance.
📊 Volatility Curves Reference
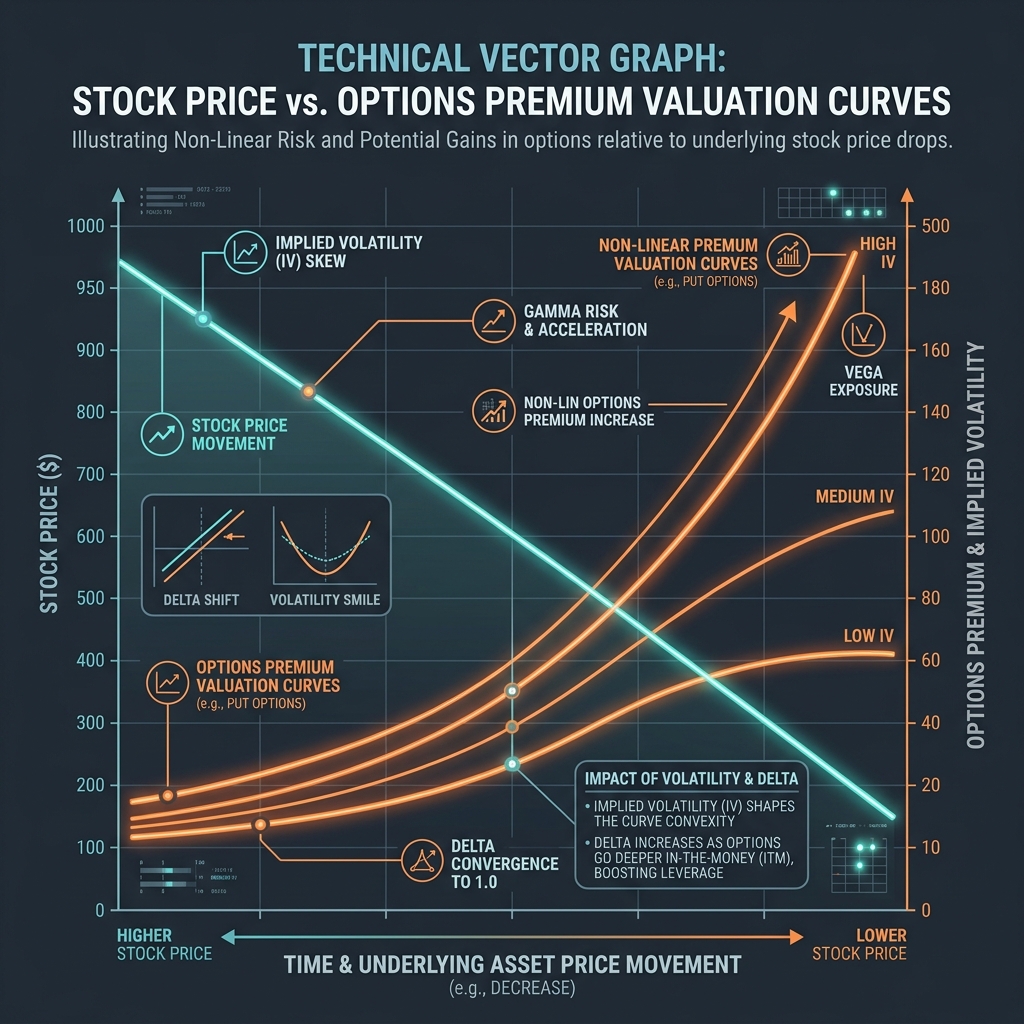
When trading options or volatile derivatives, risk exposure curves are non-linear. The chart below illustrates how option premium delta decay curves shift based on implied volatility (IV) and pricing boundaries:
🔍 Sharpe-Based Portfolio Allocation
To maximize portfolio stability, allocate capital proportionally to each strategy's Sharpe Ratio while scaling sizes inversely to their volatilities:
- Calculate Sharpe Ratios: Periodically review the monthly returns of each strategy.
- Risk-Weight Allocations: Assign larger capital weights to strategies that display high Sharpe ratios and low standard deviations ($\sigma_p$).
- Scale Down High-Variance Systems: Highly volatile trading systems must receive smaller capital allocations, ensuring they do not dominate the portfolio's total equity swings.
- (See our Kelly Criterion Sizing Guide to review mathematical formulas).
- Compute Positions Instantly: Use our browser-based Position Size Calculator to quickly model share counts and risk targets.
Join the Urbandigistore Hub
Subscribe to receive premium developer cheat sheets, advanced conversion techniques, and campaign optimization checklists. Zero spam, unsubscribe anytime.
🚀 Launch Interactive Tool
Ready to test this directly? Open the secure web tool in a new sandbox tab.