
Stop-Loss Sizing: Position Sizing with Average True Range (ATR) Volatility
Learn how to calculate volatility-adjusted stop-loss levels using the Average True Range (ATR) indicator to protect your trading portfolio.
🔧 Interactive Utility Tool
Try the free, 100% secure client-side tool associated with this guide. No registration required.
Stop-Loss Sizing: Sizing Trades with ATR Volatility
Looking for a secure way to analyze and optimize your workflows? Here is a quick reference guide on the subject.
Position sizing models are risk-management calculations used to determine optimal capital allocations. By calculating metrics like ATR volatility, maximum drawdown, or the Sharpe and Sortino ratios, traders manage protection zones and limit trade losses.
Setting a fixed percentage stop-loss (like "always exit 5% below entry") is one of the most common mistakes in technical trading. Different assets exhibit vastly different price behavior. A 5% swing on a stable large-cap index might indicate a major structural trend reversal, whereas the same 5% swing on a volatile tech stock or crypto token is just normal daily market noise.
To prevent getting stopped out by standard market noise, professional risk managers use the Average True Range (ATR). In this guide, we'll explain the mathematics of ATR, detail the sizing formula, and show you how to apply it.
Product-Led CTA: Managing risk manually is slow and leads to trading errors. Use our free, real-time Position Size Calculator to quickly model share counts and risk targets.
📐 The Mathematics of True Range
The ATR indicator, developed by J. Welles Wilder, measures market volatility by evaluating the "True Range" of price movement. The True Range ($TR$) for any given day is the greatest of:
- The distance from the current High to the current Low: $$TR_1 = \text{High} - \text{Low}$$
- The distance from the previous Close to the current High: $$TR_2 = |\text{High} - \text{Close}_{\text{prev}}|$$
- The distance from the previous Close to the current Low: $$TR_3 = |\text{Low} - \text{Close}_{\text{prev}}|$$
By taking the maximum of these three measurements, the calculation accounts for price gaps between sessions. The ATR is typically calculated as a 14-period exponential moving average of these True Range values.
⚡ Quick Action: Use the Online Tool
This guide pairs with our free, 100% secure client-side utility tool. Process your files or text instantly in-browser.
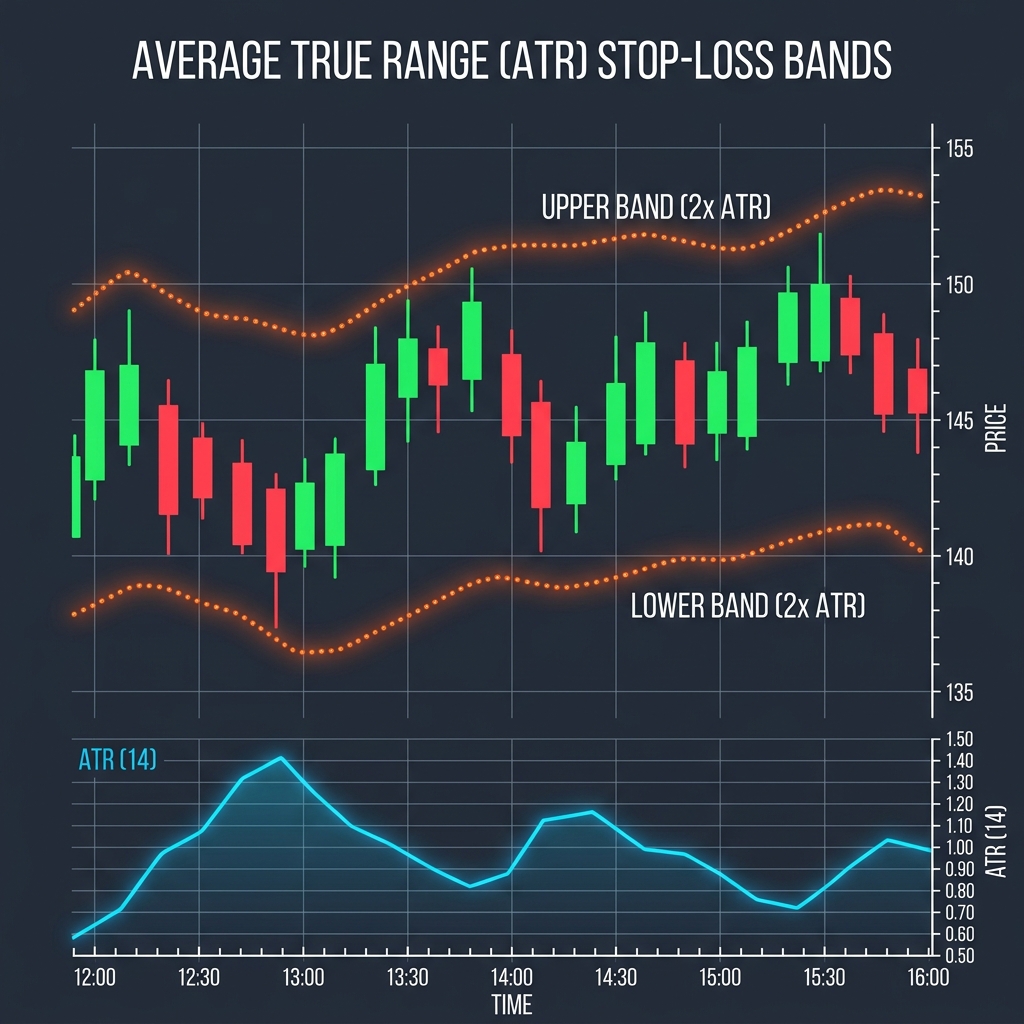
📊 Volatility-Based ATR Bands Infographic
Below is a visual layout demonstrating how upper and lower ATR envelope bands enclose price candles, providing noise-free boundaries:
🛠️ Step-by-Step ATR Sizing Strategy
To calculate your position size using ATR:
- Find the Current ATR Value: Look up the ATR (14) indicator value on your target chart (e.g. Stock trading at $100, ATR is $3.00).
- Define Volatility Multiplier: A standard stop-loss buffer is 2x ATR (or 1.5x ATR for aggressive traders). $$\text{Stop Distance} = 2 \times \text{ATR} = 2 \times \$3.00 = \$6.00$$
- Determine Entry and Stop Levels:
- Long Entry: $100.00
- Stop-Loss: $\$100.00 - \$6.00 = \mathbf{\$94.00}$
- Calculate Position Size: $$\text{Cash Risk} = \text{Account Equity} \times \text{Risk Rule}$$ (e.g., $10,000 account, risking 2% = $200 cash risk). $$\text{Shares to Buy} = \frac{\text{Cash Risk}}{\text{Stop Distance}} = \frac{\$200}{\$6.00} \approx \mathbf{33 \text{ shares}}$$
By sizing this way, a volatile asset with a high ATR will automatically result in a wider stop-loss and a smaller position size, while a stable asset with a low ATR results in a tighter stop and a larger position size, keeping your cash risk completely uniform!
🚦 Comparing Sizing Strategies
Choosing the right stop model dictates your trading longevity:
- ATR Stops: Best for trend following and swinging volatile assets; adapts dynamically to changing volatility. (Read our ATR vs. Fixed Percentage Stop Comparison).
- Margin Stops: Crucial when leverage or borrow costs drag down your equity buffer. (See Spot vs. Margin Risk Sizing).
- Geometric Stops: Derived from retracements rather than volatility. (See Bear Market Fibonacci Rules).
To run position sizing calculations instantly before entering a trade, utilize our client-side Position Size Calculator.
Join the Urbandigistore Hub
Subscribe to receive premium developer cheat sheets, advanced conversion techniques, and campaign optimization checklists. Zero spam, unsubscribe anytime.
🚀 Launch Interactive Tool
Ready to test this directly? Open the secure web tool in a new sandbox tab.