
Stop-Loss Sizing: Position Sizing by Maximum Tolerable Drawdown
Learn how to calculate position size constraints to prevent your equity curve from exceeding your historical maximum drawdown limit.
🔧 Interactive Utility Tool
Try the free, 100% secure client-side tool associated with this guide. No registration required.
Position Sizing by Maximum Tolerable Drawdown
Looking for a secure way to analyze and optimize your workflows? Here is a quick reference guide on the subject.
Position sizing models are risk-management calculations used to determine optimal capital allocations. By calculating metrics like ATR volatility, maximum drawdown, or the Sharpe and Sortino ratios, traders manage protection zones and limit trade losses.
Many traders focus entirely on the risk of individual trades (e.g., risking 2% per trade). However, if your strategy suffers a series of consecutive losses—known as a drawdown period—the total loss to your portfolio can easily exceed your risk tolerance. To protect your equity curve from catastrophic damage, you must calculate position sizes based on your Maximum Tolerable Drawdown (MTD).
In this guide, we'll explain how to calculate drawdown boundaries, manage correlations, and size trades.
Product-Led CTA: Managing risk manually is slow and leads to trading errors. Use our free, real-time Position Size Calculator to quickly model share counts and risk targets.
📐 The Drawdown Sizing Constraint
Maximum drawdown is the peak-to-trough decline in your portfolio's capital:
$$\text{Drawdown \%} = \frac{\text{Peak Value} - \text{Trough Value}}{\text{Peak Value}} \times 100$$
To limit the portfolio's maximum potential drawdown during a worst-case streak (e.g., 10 consecutive losses), use the formula:
⚡ Quick Action: Use the Online Tool
This guide pairs with our free, 100% secure client-side utility tool. Process your files or text instantly in-browser.
$$\text{Risk Per Trade \%} = \frac{\text{Maximum Tolerable Drawdown \%}}{\text{Estimated Max Consecutive Losses}}$$
For example, if your MTD is 20% and your historical strategy backtest shows a maximum of 8 consecutive losses, your risk per trade should not exceed:
$$\text{Risk Per Trade} = \frac{20\%}{8} = 2.5\% \text{ of account capital}$$
📊 Volatility Curves Reference
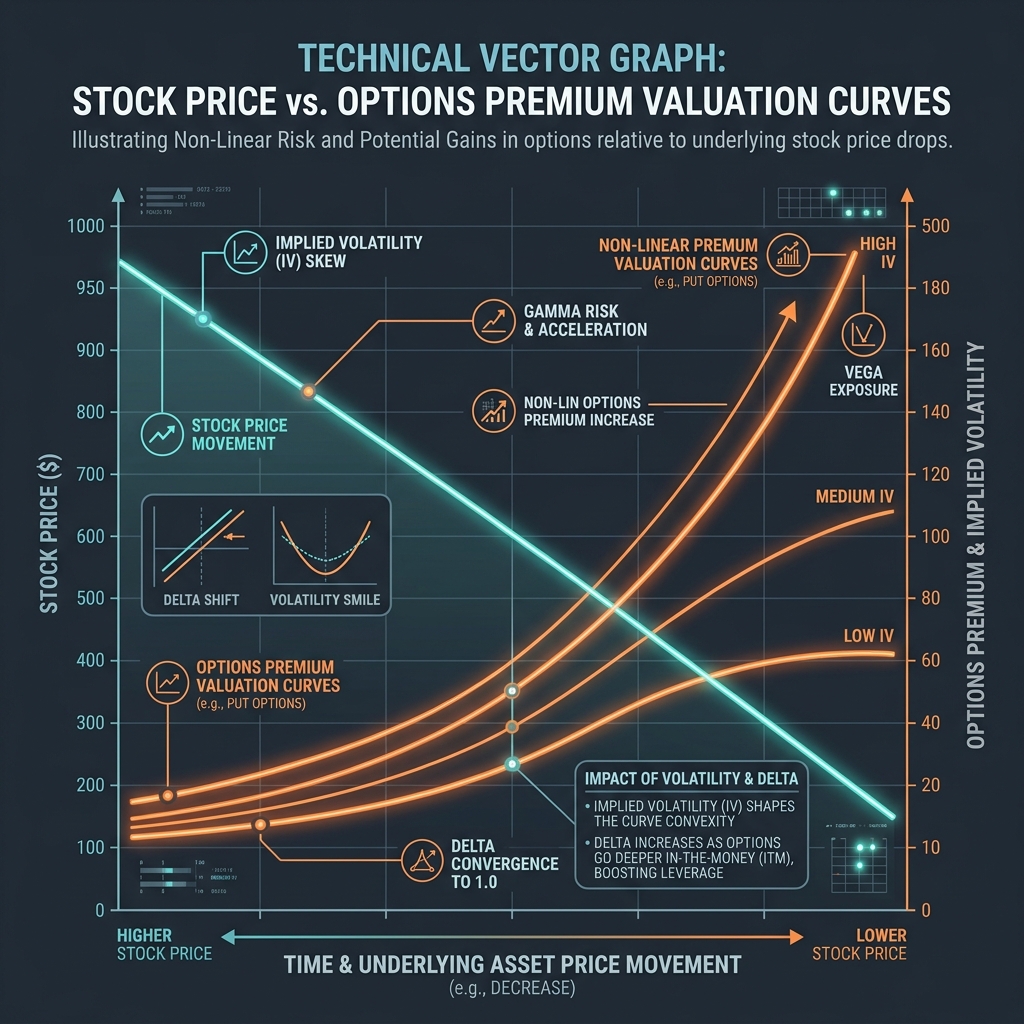
When sizing trades across options or volatile derivatives, risk curves are non-linear. The chart below illustrates how option premium delta decay curves shift based on implied volatility (IV) and pricing boundaries:
🔍 Managing Correlation Risk
Calculating drawdown limits for individual trades is only effective if your positions are uncorrelated. If you buy 5 different technology stocks and risk 2% on each, a broad sector sell-off will drop all 5 trades simultaneously. * The Outcome: Your portfolio loses 10% in a single day, destroying your drawdown constraints. * The Fix: Group correlated assets into "risk buckets." Treat the entire sector as a single position and divide the 2% risk limit among the correlated stocks.
🛠️ Portfolio Sizing Utilities
To structure your portfolio risk: * Compare Sizing Models: Read Volatility-Adjusted ATR Sizing to normalise risks. * Select Volatility Stops: Read Stop-Loss Multipliers Sizing Guide. * Compute Risk Instantly: Use our browser-based Position Size Calculator to quickly model share counts and risk targets.
Join the Urbandigistore Hub
Subscribe to receive premium developer cheat sheets, advanced conversion techniques, and campaign optimization checklists. Zero spam, unsubscribe anytime.
🚀 Launch Interactive Tool
Ready to test this directly? Open the secure web tool in a new sandbox tab.