
Stop-Loss Sizing: Position Sizing by Volatility-Adjusted Parabolic SAR
Learn how to calculate position size and trail stop-losses using Parabolic Stop and Reverse (SAR) trend indicators.
🔧 Interactive Utility Tool
Try the free, 100% secure client-side tool associated with this guide. No registration required.
Position Sizing with Parabolic SAR and Volatility
Looking for a secure way to analyze and optimize your workflows? Here is a quick reference guide on the subject.
Position sizing models are risk-management calculations used to determine optimal capital allocations. By calculating metrics like ATR volatility, maximum drawdown, or the Sharpe and Sortino ratios, traders manage protection zones and limit trade losses.
When trading strong trend accelerations, trailing your risk limits prevents holding through major reversals. Placing stop-losses at volatility-adjusted Parabolic SAR (Stop and Reverse) levels lets you adjust your risk limits dynamically as momentum increases.
Product-Led CTA: Calculating risk limits manually during fast market breakouts leads to sizing errors. Use our free, real-time Position Size Calculator to quickly model share counts and risk targets.
⚡ Quick Action: Use the Online Tool
This guide pairs with our free, 100% secure client-side utility tool. Process your files or text instantly in-browser.
📐 Parabolic SAR and Volatility Bounds
The Parabolic SAR is calculated by shifting stop points closer to the price action as trends accelerate:
- SAR Calculation: The SAR value for period $t+1$:
$$\text{SAR}_{t+1} = \text{SAR}_t + \alpha \times (\text{EP} - \text{SAR}_t)$$
Where:
- $\text{SAR}_t$ is the current SAR value.
- $\alpha$ is the acceleration factor (starts at $0.02$, increasing by $0.02$ up to a maximum of $0.20$ each time a new Extreme Point is reached).
- $\text{EP}$ is the Extreme Point (the highest high for long trades, lowest low for short trades).
📊 Volatility Bands Sizing Reference
To manage drawdown risk, traders place stop-losses using ATR volatility bands. Refer to the chart below to see how these bands establish dynamic trading channels:
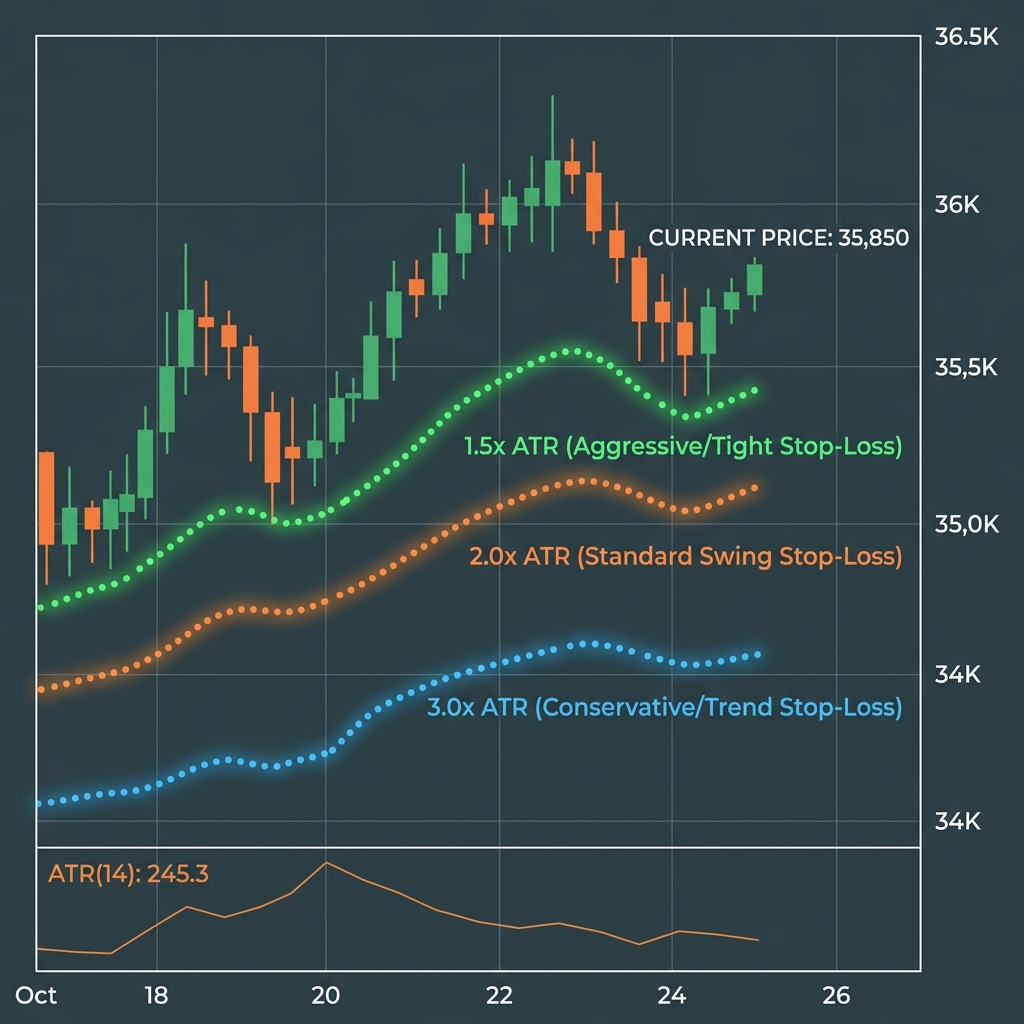
🛡️ Accelerating Risk Management
To manage acceleration risk: * SAR Acceleration Limits: Do not exceed acceleration bounds ($\alpha = 0.20$) to prevent stop points from triggering too quickly during price noise. * Vol-Adjust Sizing: As the gap between price and the SAR line widens, absolute trade risk increases. Reduce position size to protect trading capital. * Read Stop-Loss Sizing with ATR Multipliers and Volatility Adjusted ATR Sizing to learn more. * Calculate share sizes and risk distances instantly using our browser-based Position Size Calculator.
Join the Urbandigistore Hub
Subscribe to receive premium developer cheat sheets, advanced conversion techniques, and campaign optimization checklists. Zero spam, unsubscribe anytime.
🚀 Launch Interactive Tool
Ready to test this directly? Open the secure web tool in a new sandbox tab.