
Stop-Loss Sizing: Position Sizing with Volatility-Adjusted Sharpe and Sortino Ratios
Compare Sharpe and Sortino ratios to optimize trading allocations by penalizing only downside volatility instead of overall variance.
🔧 Interactive Utility Tool
Try the free, 100% secure client-side tool associated with this guide. No registration required.
Position Sizing with Sharpe and Sortino Ratios
Looking for a secure way to analyze and optimize your workflows? Here is a quick reference guide on the subject.
Position sizing models are risk-management calculations used to determine optimal capital allocations. By calculating metrics like ATR volatility, maximum drawdown, or the Sharpe and Sortino ratios, traders manage protection zones and limit trade losses.
When designing a risk management system, quantitative traders use performance ratios to determine how much capital to allocate to different assets. While the Sharpe Ratio is the industry standard for evaluating risk-adjusted returns, it has a core limitation: it treats all price fluctuations (both upside runs and downside drops) as risk. To address this, advanced portfolio managers use the Sortino Ratio to size positions.
In this guide, we'll write out both formulas, compare standard deviation versus semi-variance, and outline trade sizing rules.
Product-Led CTA: Managing risk manually is slow and leads to trading errors. Use our free, real-time Position Size Calculator to quickly model share counts and risk targets.
📐 Sharpe vs. Sortino: The Math Comparison
Both ratios evaluate excess return relative to volatility, but they define volatility differently:
1. The Sharpe Ratio Formula
The Sharpe ratio scales excess return against the total standard deviation ($\sigma_p$) of the asset's returns:
$$\text{Sharpe Ratio} = \frac{R_p - R_f}{\sigma_p}$$
⚡ Quick Action: Use the Online Tool
This guide pairs with our free, 100% secure client-side utility tool. Process your files or text instantly in-browser.
2. The Sortino Ratio Formula
The Sortino ratio replaces standard deviation with downside deviation ($\sigma_d$, also known as semi-variance). It ignores positive returns and penalizes only negative returns that fall below a Target Acceptable Return ($T$):
$$\text{Sortino Ratio} = \frac{R_p - T}{\sigma_d}$$
$$\text{Where downside deviation } \sigma_d = \sqrt{\frac{1}{N} \sum_{i=1}^{N} \min(0, R_i - T)^2}$$
📊 Volatility Curves Reference
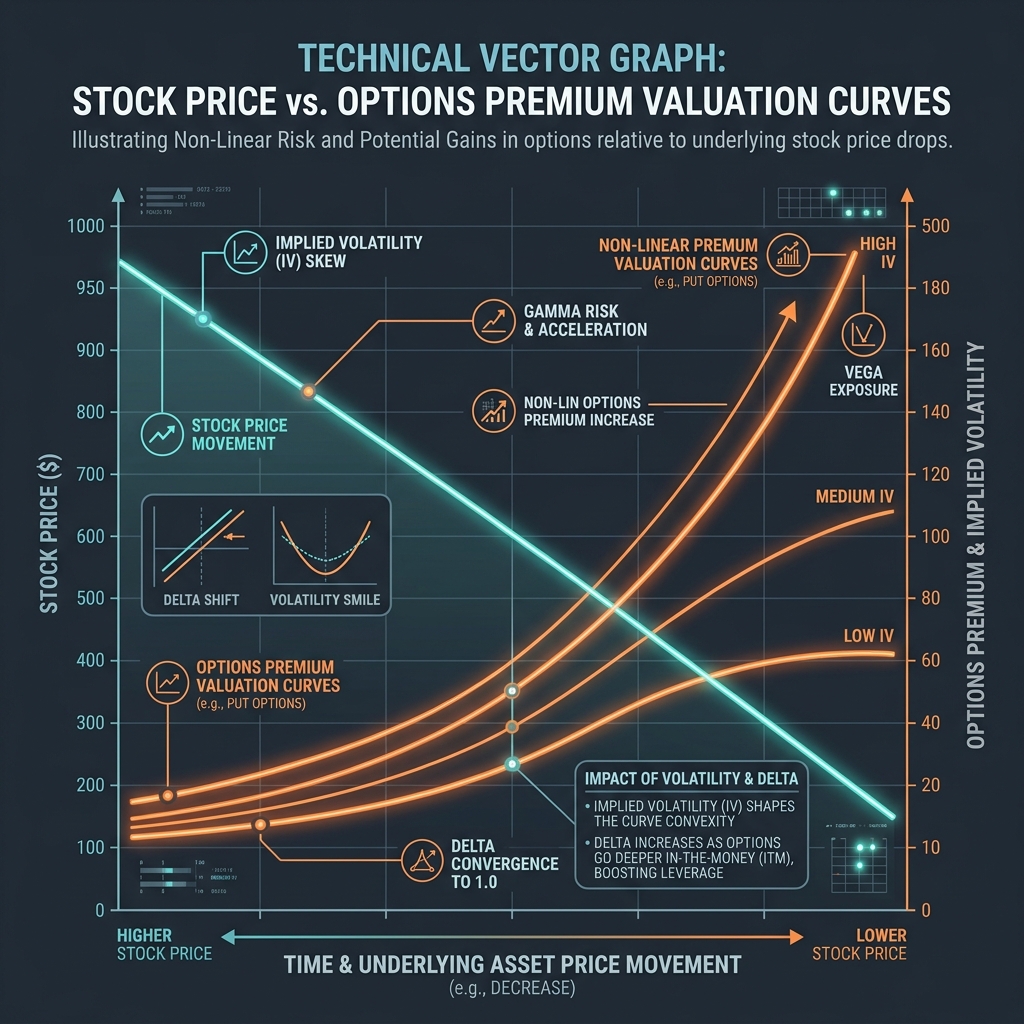
When trading options or volatile derivatives, risk exposure curves are non-linear. The chart below illustrates how option premium delta decay curves shift based on implied volatility (IV) and pricing boundaries:
🔍 Why the Sortino Ratio is Superior for Traders
Because the Sharpe ratio uses standard deviation, a strategy that experiences rapid, massive upward spikes will show a lower Sharpe ratio because those spikes increase the total variance. * The Flaw: Sharpe penalizes positive volatility, which is the exact outcome a trader wants. * The Solution: The Sortino ratio only penalizes downside volatility. A strategy with steady performance and sudden upward breakouts will have a significantly higher Sortino ratio, reflecting its true risk-adjusted superiority.
⚙️ Allocating Capital by Sortino Scaling
To maximize risk-adjusted equity growth: 1. Risk-Weight Allocations: Assign larger capital weights to assets displaying high Sortino ratios. 2. Scale Down High-Downside Assets: Assets with large downside semi-variance must receive smaller allocations, keeping your portfolio's total risk constant. 3. (See our Kelly Criterion Sizing Guide and Sharpe Ratio Sizing Guide to review mathematical formulas). 4. Compute Positions Instantly: Use our browser-based Position Size Calculator to quickly model share counts and risk targets.
Join the Urbandigistore Hub
Subscribe to receive premium developer cheat sheets, advanced conversion techniques, and campaign optimization checklists. Zero spam, unsubscribe anytime.
🚀 Launch Interactive Tool
Ready to test this directly? Open the secure web tool in a new sandbox tab.