
Stop-Loss Sizing: Position Sizing by Sortino Ratio and Downside Deviation
Learn how to calculate downside deviation (semi-variance) and use the Sortino Ratio to optimize your portfolio position sizing.
🔧 Interactive Utility Tool
Try the free, 100% secure client-side tool associated with this guide. No registration required.
Position Sizing with Sortino Downside Deviation
Looking for a secure way to analyze and optimize your workflows? Here is a quick reference guide on the subject.
Position sizing models are risk-management calculations used to determine optimal capital allocations. By calculating metrics like ATR volatility, maximum drawdown, or the Sharpe and Sortino ratios, traders manage protection zones and limit trade losses.
When managing a trading portfolio, allocating capital based on the standard Sharpe Ratio has a key limitation: it treats all price variance (both upward jumps and downward drops) as risk. To optimize capital allocation, modern quantitative managers use the Sortino Ratio. The Sortino ratio isolates risk by replacing standard deviation with Downside Deviation (semi-variance).
In this guide, we'll write out the downside deviation formula, explain why standard deviation is flawed for active traders, and outline position sizing rules.
Product-Led CTA: Managing risk manually is slow and leads to trading errors. Use our free, real-time Position Size Calculator to quickly model share counts and risk targets.
📐 The Downside Deviation Formula
Downside deviation ($\sigma_d$) measures only the volatility that falls below a Target Acceptable Return ($T$, often set to zero or the risk-free rate of return):
⚡ Quick Action: Use the Online Tool
This guide pairs with our free, 100% secure client-side utility tool. Process your files or text instantly in-browser.
$$\sigma_d = \sqrt{\frac{1}{N} \sum_{i=1}^{N} \min(0, R_i - T)^2}$$
Where: * $R_i$: The return of the asset or strategy for period $i$. * $T$: The target acceptable return threshold. * $N$: The total number of periods in the lookback window.
By squaring only the returns that fall below $T$, downside deviation ignores positive performance spikes, providing a more accurate measure of actual risk.
📊 Volatility Bands Reference
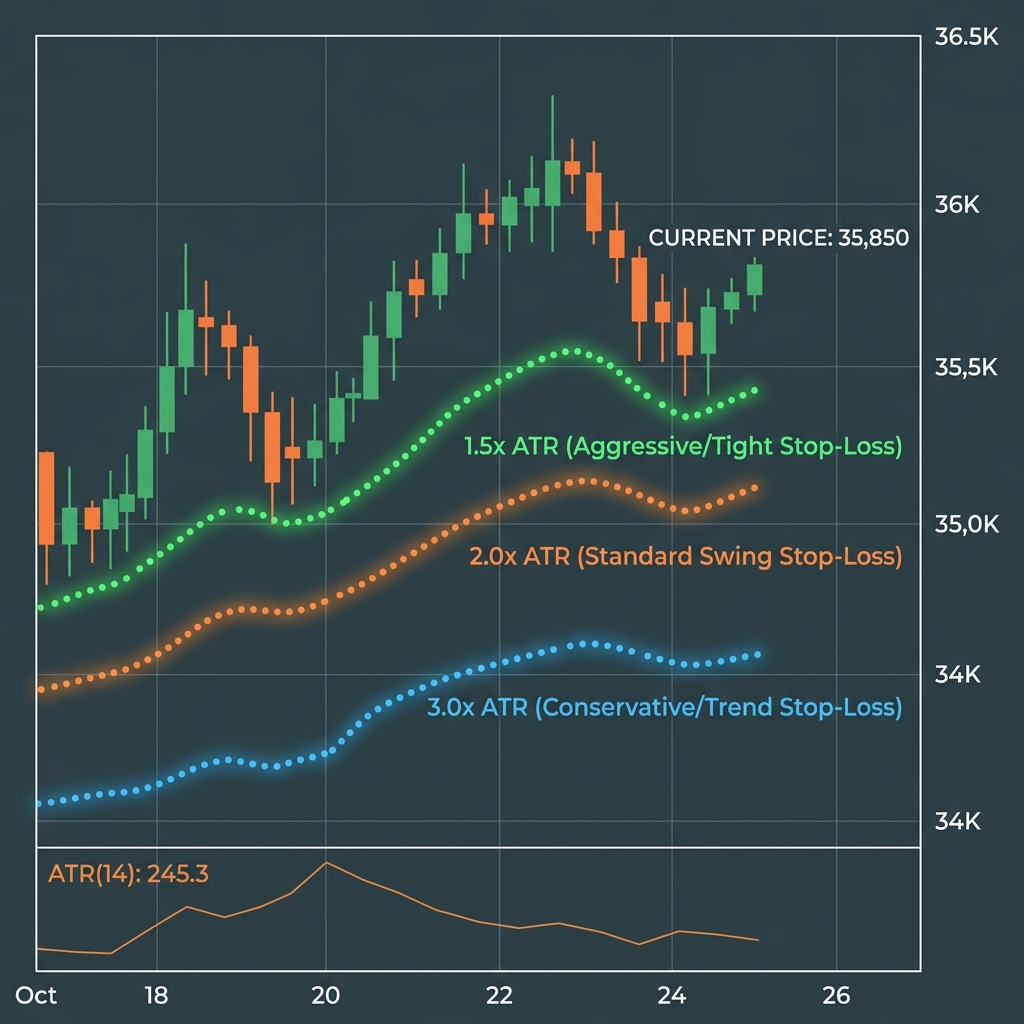
When planning entries, traders use ATR volatility bands to structure protection zones. The chart below illustrates how volatility bands establish risk parameters around asset price channels:
🔍 Why Downside Deviation Improves Sizing
Standard deviation penalizes a strategy for large positive returns, lowering its Sharpe ratio and leading to sub-optimal sizing. In contrast, downside deviation: * Isolates True Risk: Only counts downside drops, ensuring that strategies with steady performance and sudden upward breakouts receive their deservedly higher allocations. * Drawdown Management: Review the maximum historical drawdowns of your strategies. (See our Maximum Drawdown Sizing Guide to check account threshold boundaries). * Calculate Positions Instantly: Use our browser-based Position Size Calculator to quickly model share counts and risk targets. * (See our Sharpe vs Sortino Sizing Guide to review mathematical comparisons).
Join the Urbandigistore Hub
Subscribe to receive premium developer cheat sheets, advanced conversion techniques, and campaign optimization checklists. Zero spam, unsubscribe anytime.
🚀 Launch Interactive Tool
Ready to test this directly? Open the secure web tool in a new sandbox tab.